Testimony of Guy Brandenburg, retired DCPS mathematics teacher before the DC City Council Committee on Education Roundtable, December 14, 2013 at McKinley Tech
Hello, Mr. Catania, audience members, and any other DC City Council members who may be present. I am a veteran DC math teacher who began teaching in Southeast DC about 35 years ago, and spent my last 15 years of teaching at Alice Deal JHS/MS. I taught everything from remedial 7th grade math through pre-calculus, as well as computer applications.
Among other things, I coached MathCounts teams at Deal and at Francis JHS, with my students often taking first place against all other public, private, and charter schools in the city and going on to compete against other state teams. As a result, I have several boxes full of trophies and some teaching awards.
Since retiring, I have been helping Math for America – DC (which is totally different from Teach for America) in training and mentoring new but highly skilled math teachers in DC public and charter schools; operating a blog that mostly concerns education; teaching astronomy and telescope making as an unpaid volunteer; and also tutoring [as a volunteer] students at the school closest to my house in Brookland, where my daughter attended kindergarten about 25 years ago.
But this testimony is not about me; as a result, I won’t read the previous paragraphs aloud.
My testimony is about how the public is being deceived with bogus statistics into thinking things are getting tremendously better under mayoral control of schools and under the chancellorships of Rhee and Henderson.
In particular, I want to show that the Value-Added measurements that are used to evaluate teachers are unreliable, invalid, and do not help teachers improve their methods of instruction. To the contrary: IVA measurements are driving a number of excellent, veteran teachers to resign or be fired from DCPS to go elsewhere.
I will try to show this mostly with graphs made by me and others, because in statistics, a good scatter plot is worth many a word or formula.
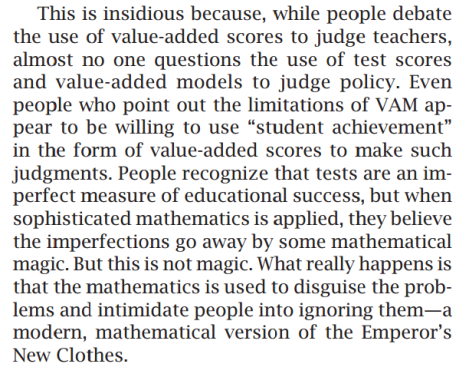
John Ewing, who is the president of Math for America and is a former executive director of the American Mathematical Society, wrote that VAM is “mathematical intimidation” and not reliable. I quote:
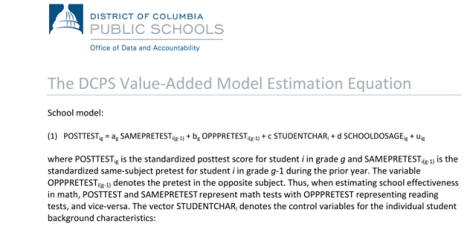
In case you were wondering how the formula goes, this is all that one of my colleagues was able to pry from Jason Kamras after SIX MONTHS of back-and-forth emails asking for additional information:
One problem with that formula is that nobody outside a small group of highly-paid consultants has any idea what are the values of any of those variables. What’s more, many of those variables are composed of lists or matrices (“vectors”) of other variables.
In not a single case has the Office of Data and Accountability sat down with a teacher and explained, in detail, exactly how a teachers’ score is calculated, student by student, class by class, test score by test score.
Nor has that office shared that data with the Washington Teachers’ Union.
It’s the mathematics of intimidation, lack of accountability, and obfuscation.
I would ask you, Mr. Catania, to ask the Office of Data and Accountability to share with the WTU all IMPACT scores for every single teacher, including all the sub-scores, such as those for IVA and classroom observations.
To put a personal touch to my data, one of my former Deal colleagues shared with me that she resigned from DCPS specifically because her IVA scores kept bouncing around with no apparent reason. In fact, the year that she thought she did her very best job ever in her entire career – that’s when she earned her lowest value-added score. She now teaches in Montgomery County and recently earned the distinction of becoming a National Board Certified teacher – a loss for DCPS students, but a gain for those in Maryland.
Bill Turque of the Washington Post documented the case of Sarah Wysocki, an excellent teacher with outstanding classroom observation results, who was fired by DCPS for low IVA scores. She is now happily teaching in Virginia. I am positive that these two examples can be multiplied many times over.
Now let’s look at some statistics. As I mentioned, in many cases, pictures and graphs speak more clearly than words or numbers or equations.
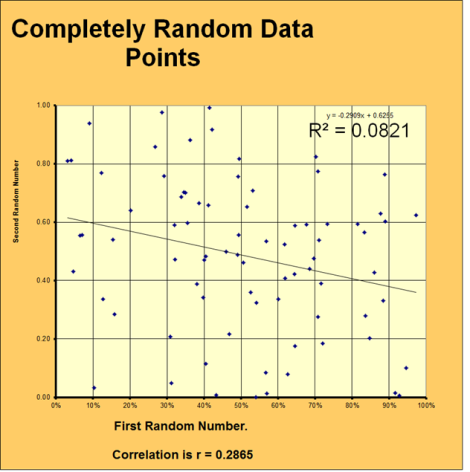
My first graph is of completely random data points that should show absolutely no correlation with each other, meaning, they are not linked to each other in any way. I had my Excel spreadsheet to make two lists of random numbers, and I plotted those as the x- and y- variables on the following graph.
I asked Excel also to draw a line of best fit and to calculate the correlation coefficient R and R-squared. It did so, as you can see, R-squared is very low, about 0.08 (eight percent). R, the square root of R-squared, is about 29 percent.
Remember, those are completely random numbers generated by Excel.
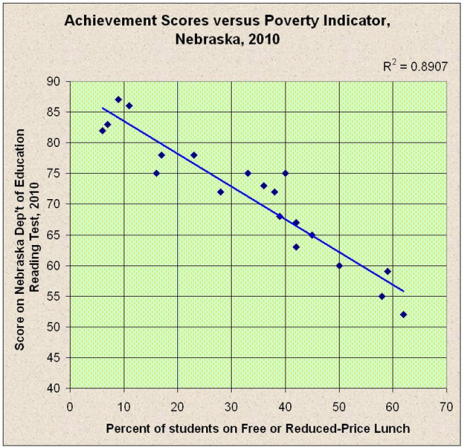
Now let’s look at a very strong correlation of real numbers: poverty rates and student achievement in a number of states. The first one is for Nebraska.
R would be about 94% in this case – a very strong correlation indeed.
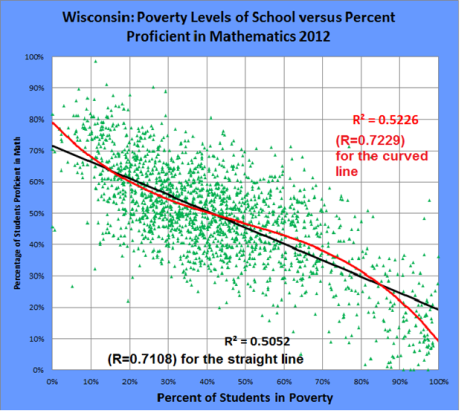
The next one is for Wisconsin:
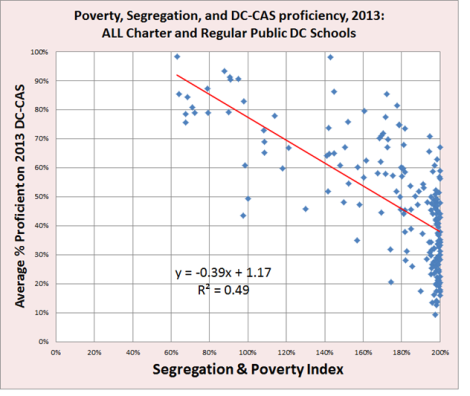
Again, quite a strong correlation – a negative one: the poorer the student body, the lower the average achievement, which we see repeated in every state and every country in the world. Including DC, as you can see here:
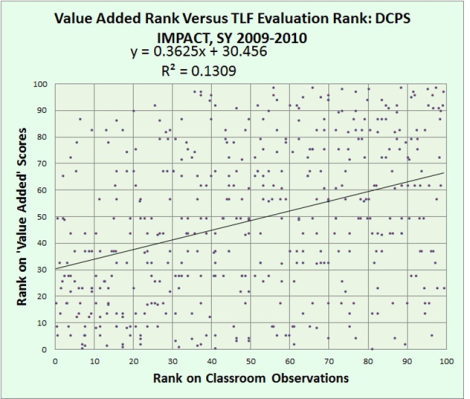
Now, how about those Value-Added scores? Do they correlate with classroom observations?
Mostly, we don’t know, because the data is kept secret. However, someone leaked to me the IVA and classroom observation scores for all DCPS teachers for SY 2009-10, and I plotted them. Is this a strong correlation, or not?
I would say this looks pretty much like no correlation at all. What on earth are these two things measuring? It certainly gives teachers no assistance on what to improve in order to help their students learn better.
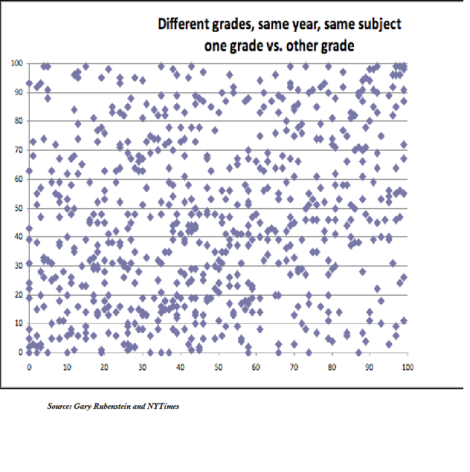
And how stable are Value-Added measurements over time? If they are stable, that would mean that we might be able to use them to weed out the teachers who consistently score at the bottom, and reward those who consistently score at the top.
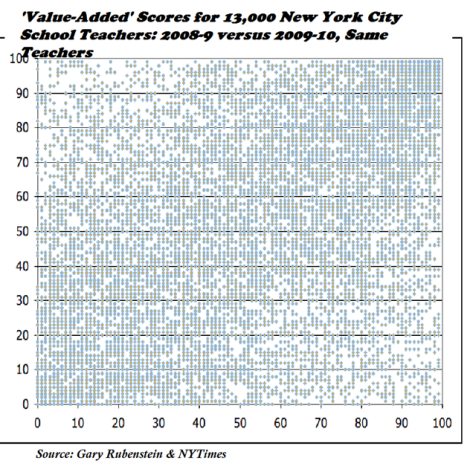
Unfortunately, since DCPS keeps all the data hidden, we don’t exactly know how stable these scores are here. However, the New York Times leaked the value-added data for NYC teachers for several years, and we can look at those scores to see.
Here is one such graph:
That is very close to random.
How about teachers who teach the same subject to two different grade levels (say, fourth-grade math and fifth-grade math)? Again, random points:
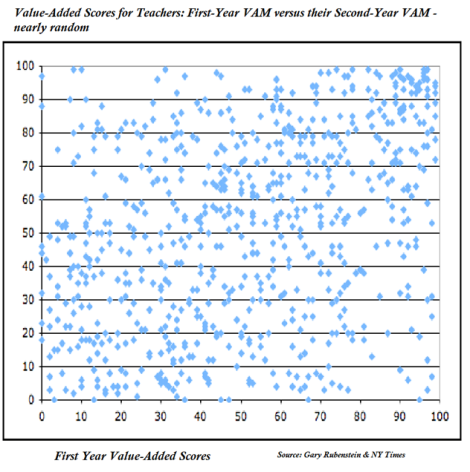
One thing that all veteran teachers agree on is that they stunk at their job during their first year and got a lot better their second year. This should show up on value-added graphs of year 1 versus year 2 scores for the same teachers, right?
Wrong.
Take a look:
One last point:
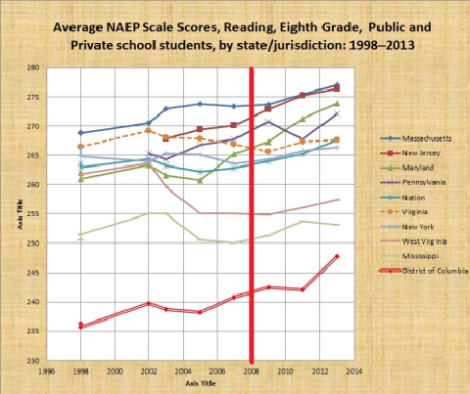
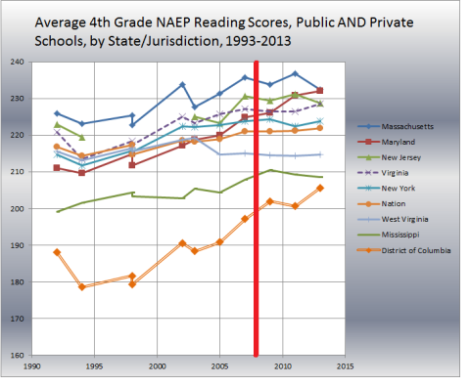
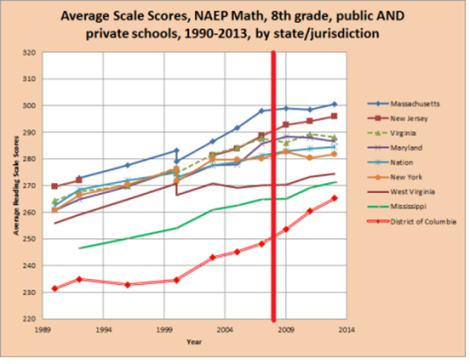
Mayor Gray and chancellors Henderson and Rhee all claim that education in DC only started improving after mayoral control of the schools, starting in 2007.
Graphs and the NAEP show a different story. We won’t know until next week how DCPS and the charter schools did, separately, for 2013, but the following graphs show that reading andmath scores for DC fourth- and eighth-graders have been rising fairly steadily for nearly twenty years, or long before mayoral control or the appointments of our two chancellors (Rhee and Henderson).
Wow, this is a great article, the pictures are especially telling. I have a question maybe you can help me with–Am I correct in my understanding that teacher quality is measured by test scores then regressed on more test scores? If so, doesn’t this violates the most basic assumption of the statistics, that the variables are independent?
LikeLike
Not exactly.
What I showed was that there is in fact no correlation between how teachers score on an elaborate classroom- observation system , in the one hand, and how they score on an elaborate test-score- improvement system on the other.
And that all that data is kept hidden.
LikeLike
Great testimony Guy. Since the data is now out on how many kids are being kicked out of schools it would be interesting to take the small group of high poverty schools in DC where kids are beating the state average on the DC-CAS and see whether they have above average kick out rates.
LikeLike
[…] Bottom line conclusion from my last bunch of posts (see #1, #2, #3, #4, #5, #6) […]
LikeLike
[…] Brandenburg, a retired DCPS mathematics teacher, provided testimony before the DC City Council Committee on Education Roundtable looking at the value added model for […]
LikeLike