You may have read the article in today’s Washington Post where Education DEformer-in-chief Arne Duncan claimed that the DC NAEP TUDA scores were “great examples for the rest of the country of what can happen when schools embrace innovative reforms and do the hard work necessary to ensure that all students graduate ready for college and careers.”
Oh, really?
Let’s remember that those “innovative reforms” started with the 2009-10 school year, though Chancellor Rhee took over at the beginning of the 2007-8 school year and fired a few hundred teachers the next school year.
Whichever date you use, a casual glance at the graphs published by the National Assessment of Educational Progress (NAEP) in their Trial Urban District Assessment (TUDA) shows that all those expensive billionaire-directed reforms have had nearly no effect in the District of Columbia, except for one: gap between the haves and have-nots is growing wider, not smaller. Otherwise, trends that began in 2002 or 2003 have pretty much continued.
It makes me wonder: Is Arne Duncan merely stupid and can’t even read simple graphs, or is he just a highly-paid liar and shill for the billionaires who have succeeded in hijacking our school system and in eliminating tenure for teachers, eliminating art, recess, PE and music for millions of inner-city students?
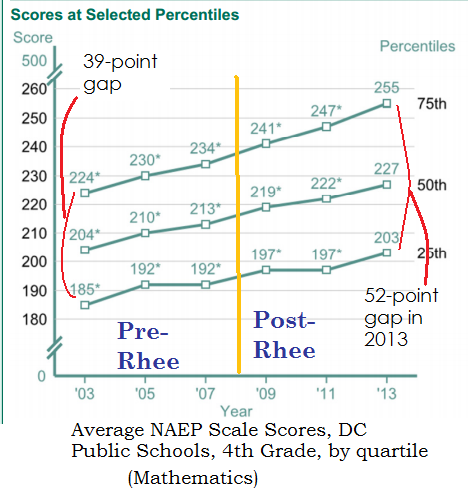
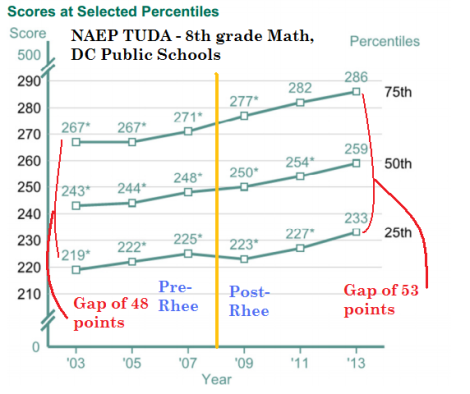
You decide, after looking at these graphs which I lifted from the NAEP TUDA website. The “Pre-Rhee” and “Post-Rhee” markers and some color and labels for clarity were added by me. Otherwise, I didn’t change a thing, and I didn’t have to do any complicated digging or perform any statistical tricks whatsoever to find these graphs.
First, let’s look at how students in DC Public Schools fared at the fourth and eighth grade, in reading and math, as compared with each other. Meaning, how did kids at the 75th percentile (top quartile) do, compared to the kids at the median (50th percentile), and compared to the kids at the 25th quartile (bottom quartile), over the past decade or so.
That was for fourth-grade math. All three of the green lines slant mostly up to the right, meaning their scores are improving, which is generally a good thing. But do you honestly see any big difference between the pre-Rhee years and the post-Rhee years? The only real difference I see is that the gap between the top scorers is getting gradually wider, which is NOT a good thing. The gap used to be about 39 points but is now 52 points.
The next one is for fourth-grade reading.
I’m not even going to complain that the bottom-quartile students are now scoring slightly lower than they were in 2009, since I know there is a lot of small random variation from one year to year because of the small sample sizes. However, NAEP themselves claim that the reading scores for the 25h- and 50th-percentile kids this year are NOT significantly different from what they were going back 6 to 8 years. And we can see that the gap between the top scorers and bottom scorers seems to be a lot wider now.
Some great progress, huh? Definitely worth subjecting teachers to a random-number-generator called IVA in order to fire them randomly for that!
Now let’s look at 8th graders:
That previous graph was for 8th grade math students in DC public schools. Do you see any great changes in trends from the pre-Rhee era to the post-Rhee era. I surely don’t. Was this “change” worth getting rid of democratic local control of the school system?
Lastly, in this post, let’s look at the same sort of graph for 8th grade reading:
Here, the big trend seems to have been a fairly large drop-off in scores for the bottom quartile right after Rhee was anointed Chancellor, but those scores have almost reached the levels of 2002. Otherwise, no significant changes.
So, let me repeat the question:
Is Arne Duncan merely stupid, or just a liar?


Re: “great examples for the rest of the country of what can happen when schools embrace innovative reforms and do the hard work necessary to ensure that all students graduate ready for college and careers.”
Arne’s PR is obviously generated by one of those Randumb Buzz Word Bots that fill my blog with spam 100 times a day.
LikeLike
It’s defensive lying, having multiple goals. One is to deceive the under/uninformed and get them on board, the more sinister and dangerous is to distract and offend opponents with the absurdities of a rancid bait that’s very hard not to rise to take. While we must continue to refute the deformer garbage, more of our energy should go towards contacting our ‘elected’ representatives to inform them that a growing number of their constituents are not falling for the lies anymore, and it’s long past time that they did the same. As a professional liar, Duncan is about on par with the likes of another vile shill, Richard Berman. The major difference is that Berman, being in the private sector of the lie machine is getting rich doing it. Duncan has to wait for the revolving door to open up for him after he’s out of the DOE. http://bermanexposed.org/
LikeLike
[…] the past few posts, (#1, #2, #3) I’ve merely cut-and-pasted graphs or text that the National Center for Educational […]
LikeLike
[…] line conclusion from my last bunch of posts (see #1, #2, #3, #4, #5, […]
LikeLike