Even-handed video from Al-Jazeera interviewing some of the people involved in the anti-Value-Added-Model lawsuit against Value-Added Model evalutations of teachers in New York state.
You may have heard of the lawsuit – it was filed by elementary teacher Sherri Lederman and her lawyer, who is also her husband.
Parents, students, and administrators had nothing but glowing praise for teacher Lederman. In fact, Sherri’s principal is quoted as saying,
“any computer program claiming Lederman ‘ineffective’ is fundamentally flawed.”
Lederman herself states,
“The model doesn’t work. It’s misrepresenting an entire profession.”
Statistician Aaron Pallas of Columbia University states,
“In Sherri’s case, she went from a 14 out of 20, which was fully in the effective range, to 1 out of 20 [the very next year], ineffective, and we look at that and say, ‘How can this be? Can a teacher’s performance really have changed that dramatically from one year to the next?’
“And if the numbers are really jumping around like that, can we really trust that they are telling us something important about a teacher’s career?”
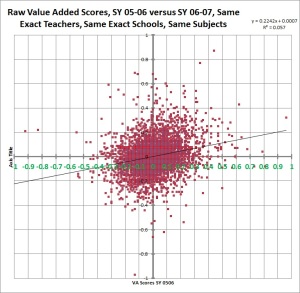
Professor Pallas could perhaps have used one of my graphs as a visual aid, to help show just how much those scores do jump around from year to year, as you see here. This one shows how raw value-added scores for teachers in New York City in school year 2005-2006 correlated with those very same teachers, teaching the same grade level students in the very same schools the exact same subjects, one year later. Gary Rubinstein has similar graphs. You can look here, here, here, or here. if you want to see some more from me on this topic.
The plot that follows is a classic case of ‘nearly no correlation whatsoever’ that we now teach to kids in middle school.
In other words, yes, teachers’ scores do, indeed jump around like crazy from year to year. If you were above average on VAM one year – that is, to the right of the Y axis anywhere, it is quite likely that you will end under the X-axis (and hence below average) the next year. Or not.
I am glad somebody is finally taking this to court, because this sort of mathematics of intimidation has got to stop.

I don’t think I’d seen that before. So essentially VAM is a random number generator. NYS is insane.
LikeLike
BUT, it is random with a purpose. I allows administrators to fire anyone, based on a randomly-generated number, thus giving administrators unchecked authority, and keeping teachers in a state of constant fear. It is not insane, it is very purposeful.
LikeLike
I think the purges under Stalin and the “criticism” by the Red Guards under Mao were also like that – random persecutions with the goal of making everybody realize that they could be next, no matter what they did. Their only hope was to be even more rabidly Red than everybody else. At least here, teachers can quit.
LikeLike
Reblogged this on Dolphin.
LikeLike
[…] from one subject to the next. See my blog (not all on NY City) here, here, here, here, here, here, here, here, here, here, and here. See Gary R’s six part series on his blog here, here, […]
LikeLike