Perhaps you read or heard that the 12th grade NAEP reading and math scores, which just got reported, were “flat“.
Did you wonder what that meant?
The short answer is: those scores have essentially not changed since they began giving the tests! Not for the kids at the top of the testing heap, not for those at the bottom, not for blacks, not for whites, not for hispanics.
No change, nada, zip.
Not even after a full dozen years of Bush’s looney No Child Left Behind Act, nor its twisted Obama-style descendant, Race to the Trough. Top.
I took a look at the official reports and I’ve plotted them here you can see how little effect all those billions spent on testing; firing veteran teachers; writing and publishing new tests and standards; and opening thousands of charter schools has had.
Here are the tables:

This first graph shows that other than a slight widening of the gap between the kids at the top (at the 90th percentile) and those at the bottom (at the 10th percentile) back in the early 1990s, there has been essentially no change in the average scores over the past two full decades.
I think we can assume that the test makers, who are professional psychometricians and not political appointees, tried their very best to make the test of equal difficulty every year. So those flat lines mean that there has been no change, despite all the efforts of the education secretaries of Clinton, Bush 2, and Obama. And despite the wholesale replacement of an enormous fraction of the nation’s teachers, and the handing over of public education resources to charter school operators.

This next graph shows much the same thing, but the data is broken down into ethnic/racial groups. Again, these lines are about as flat (horizontal) as you will ever see in the social sciences,
However, I think it’s instructive to note that the gap between, say, Hispanic and Black students on the one hand, and White and Asian students on the other, is much smaller than the gap between the 10th and 90th percentiles we saw in the very first graph: about 30 points as opposed to almost 100 points.

The third graph shows the NAEP math scores for 12th graders since 2005, since that was the first time that the test was given. The psychometricians atNAEP claim there has been a :statistically significant” change since 2005 in some of those scores, but I don’t really see it. Being “statistically significant’ and being REALLY significant are two different things.
*Note: the 12th grade Math NAEP was given for the first time in 2005, unlike the 12th grade reading test.
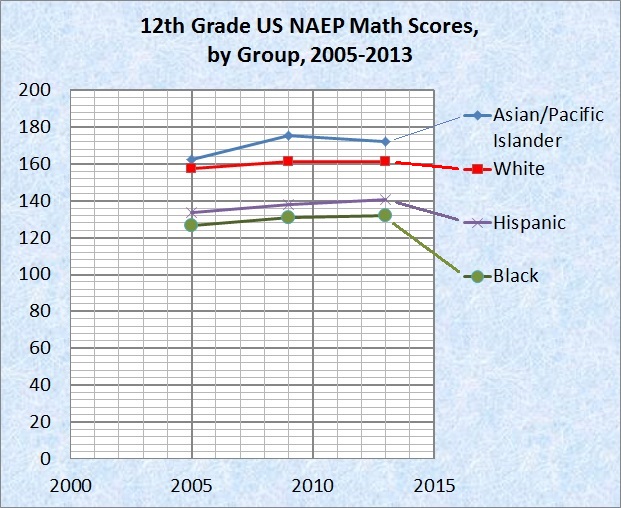
And here we have the same data broken down by ethnic/racial groups. Since 2009 there has been essentially no change, and there was precious little before that, except for Asian students.
Diane Ravitch correctly dismissed all of this as a sign that everything that Rod Paige, Margaret Spellings and Arne Duncan have done, is a complete and utter failure. Her conclusion, which I agree with, is that NCLB and RTTT need to be thrown out.

[…] A brilliant post by G.F. Brandenburg about NAEP scores. […]
LikeLike
Reblogged this on Science Magic Parties and commented:
Data analysis of all of the over-testing of American Children.
Lots of money spent, no improvement.
LikeLike
[…] using these NAEP results to support its argument. Here’s Guy Brandenburg’s analysis. In his blog, he asks, ‘Just how flat are those 12th grade NAEP scores?’ His answer, in part: “The short […]
LikeLike
[…] a particularly lucid analysis of the NAEP scores that were released last week, Merrow refers us to Guy Brandenburg’s blog. Brandenburg writes: “Perhaps you read or heard that the 12th grade NAEP reading and math […]
LikeLike
[…] Indeed, in 2013, with an additional two years of privatizing reform under America’s belt, NAEP scores remained flat. […]
LikeLike
[…] Indeed, in 2013, with an additional two years of privatizing reform under America’s belt, NAEP scores remained flat. […]
LikeLike
[…] Indeed, in 2013, with an additional two years of privatizing reform under America’s belt, NAEP scores remained flat. […]
LikeLike
thank god for truth tellers, and double thanks when they show they can connect the dots, not just memorize them or preach them, sans any interest in the evidence showing they’ve backed the wrong dots: the mindset of the gates/broad/walmart crowd.
cheers. and let’s read more of your good work.
LikeLike
[…] Indeed, in 2013, with an additional two years of privatizing reform under America’s belt, NAEP scores remained flat. […]
LikeLike
[…] Indeed, in 2013, with an additional two years of privatizing reform under America’s belt, NAEP scores remained flat. […]
LikeLike
We just posted a link to our page: https://www.facebook.com/BadassSchoolBoardMembers
LikeLike
… [Trackback]
[…] Read More: gfbrandenburg.wordpress.com/2014/05/08/just-how-flat-are-those-12th-grade-naep-scores/ […]
LikeLike
[…] Indeed, in 2013, with an additional two years of privatizing reform under America’s belt, NAEP scores remained flat. […]
LikeLike