How to detect bullcrap better

(And why Wikipedia is a better source than most people think!)

============

Site logo image
Tip icon image

Read on blog or ReaderLarry Cuban on School Reform and Classroom Practice

Teaching Students to Navigate the Online Landscape (Joel Breakstone, Sarah McGrew, Mark Smith, Teresa Ortega, and Sam Wineburg)

larrycuban

February 11

This article appeared in Social Education, 82(4), 2018, pp.219-222.

Joel Breakstone is director of the Stanford History Education Group at Stanford University. Sarah McGrew co-directs the Civic Online Reasoning project for the Stanford History Education Group. Teresa Ortega serves as the project manager for the Stanford History Education Group. Mark Smith is director of assessment for theStanford History Education Group. Sam Wineburg is the Margaret Jacks Professor at Stanford
University and the founder of the Stanford History
Education Group.

Since the 2016 presidential election, worries about our ability to evaluate online content have elicited much hand wringing. As a Forbes headline cautioned, “American Believe They Can Detect Fake News. Studies Show They Can’t.”1 

Our own research doubtless contributed to the collective anxiety. As part of ongoing work at the Stanford History Education Group, we created dozens of assessments to gauge middle school, high school, and college students’ ability to evaluate online content. 2 

In November 2016, we released a report summarizing trends in the 7,804 student responses we collected across 12 states. 3 At all grade levels, students struggled to make even the most basic evaluations. Middle school students could not distinguish between news articles and sponsored content. High school students were unable to identify verified social
media accounts. Even college students could not determine the organization behind a supposedly non-partisan website. In short, we found young people ill equipped to make sense of the information that floods their phones, tablets, and laptops.

Although it’s easy to bemoan how much students—and the rest of us—struggle, it’s not very useful. Instead of castigating students’ shortcomings, we’d be better served by considering what student responses teach us about their reasoning: What mistakes do they tend to make? How might we build on what they do in order to help them become more thoughtful consumers of digital content?

The thousands of student responses we reviewed reveal three common mistakes and point toward strategies to help students become more skilled evaluators of online content.

Focusing on Surface Features
Over and over, students focus on a web-site’s surface features. Such features—a site’s URL, graphics, design, and “About” page—are easy to manipulate to fit the interests of a site’s creators. Not one of
these features is a sound indicator of a site’s trustworthiness; regardless, many students put great stock in them. One of our tasks asked students to imagine they were doing research on children’s health and came across the website of the American College of Pediatricians (acpeds.org). We asked them if the web-site was a trustworthy source to learn about children’s health

Despite the site’s professional title and appearance, the American College of Pediatricians(ACP) is not the nation’s major professional organization of pediatricians—far from it. In fact, the ACP is a conserva-
tive advocacy organization established in 2002 after the longstanding professional organization for pediatricians, the American Academy of Pediatrics (AAP), came out in support of adoption for same-gender couples. The ACP is estimated to have between 200 and 500 members, compared to the 64,000 members of the AAP.4

News releases on the ACP website include headlines like, “Same-Sex Marriage—Detrimental to Children” and “Know Your ABCs: The Abortion Breast Cancer Link.” Nearly half of college students we tested failed to investigate the American College of Pediatricians and thus never discovered how it differed from the national organization of pediatricians. Instead, students trusted acpeds.org as an authoritative, disinterested source about children’s health. Most never probed beyond the site’s surface features.

As one student wrote, “It’s a trustworthy source because it does not have ads on the side of the page, it ends in .org, and it has accurate information on the page.” Another wrote, “They look credentialed, the website is well-designed and professional, they have a .org domain (which I think is pretty good).”

These students considered multiple features of the website. However, there are two big problems with these evaluations. 

First, such features are laughably easy to manage and tweak. Any well-
resourced organization can hire web developers to make its website appear professional and concoct a neutral description for its “About” page. 

Second, none of the features students noted attest to a site’s trustworthiness. The absence of advertising on a page does not make a site reliable and a .org domain communicates nothing definitive about credibility. Yet, many students treated these features as if they were seals of approval. Students would have learned far more about the site had they asked themselves just one question: What, exactly, is the American
College of Pediatricians?

Accepting Evidence Unquestioningly

One factor dominates students’ decisions about whether information is trustworthy: the appearance of “evidence.” Graphs, charts, infographics, photographs, and videos are particularly persuasive. Students often conclude that a post is trustworthy simply because it includes evidence to back its claims.
What’s the problem with this? Students do not stop to ask whether the evidence is trustworthy or sufficient to support the claims a site makes. The mere existence of evidence, the more the better, often does the trick.

One of our tasks directed students to a video posted on Facebook. Uploaded by the account “I on Flicks,” the video, “Democrats BUSTED on CAMERA STUFFING BALLOT Boxes,” claims to capture “2016 Democrat Primary Voter Fraud CAUGHT ON TAPE.” Two and a half minutes long, the clip shows
people furtively stuffing stacks of ballots into ballot boxes in what are purportedly precincts in Illinois, Pennsylvania, and Arizona. We asked students, “Does this clip provide strong evidence of voter
fraud during the 2016 Democratic primary election?”

The video immediately raises concerns. We know nothing about who posted it. It provides no proof that it shows electoral irregularities in the states listed. In fact, a half-minute of online digging reveals that it was originally posted on the BBC website with the headline “Russian voting fraud caught on webcam.” However, the majority of high school students we surveyed accepted the video as conclusive evidence of U.S. voter fraud, never consulting the larger web to help them make a judgment. 

The following answer reflects how easily students were taken in: “The video shows footage of people shoving multiple sheets of paper into a ballot box in isolated places. We can see the expressions of the people shoving paper into the ballot box and I can tell that they are being secretive and ashamed of their actions.”

Sixty percent of high school students accepted the video without raising questions about its source. For them, seeing was believing: The “evidence” was so compelling that students could see nothing else.

Misunderstanding Wikipedia

Despite students’ general credulity, they are sharply skeptical about one website: Wikipedia. Their responses show a distorted understanding about the site and a misunderstanding of its value as a research tool. We asked students to compare two websites: the Wikipedia entry on “Gun
Politics in the U.S.” and a National Rifle Association (NRA) article, “Ten Myths
about Gun Control,” posted on a personal page on Duke University’s website.

The task asked students to imagine that they were doing research on gun control and came across both sites. It then asked which of the two sites was a better place to start their research.
Most students argued that they would start with the NRA article because it carries an .edu designation from a prestigious university. Wikipedia, on the other hand, was considered categorically unreliable. As one student succinctly summed it up: “Wikipedia is never that reliable
for research!!!”

Why are students so distrustful of Wikipedia? The most common explana-
tion students provided was that anyone can edit a Wikipedia page. One student explained, “I would not start my research
with the Wikipedia page because anyone can edit Wikipedia even if they
have absolutely no credibility, so much of the information could be inaccurate.”

Another simply noted, “Anyone can edit information on Wikipedia.” While these students have learned that Wikipedia is open-sourced, they have not learned how Wikipedia regulates and monitors its content, from locking pages on many contentious issues to deploying bots to quickly correct vandalized pages.

Furthermore, these students have not learned that many Wikipedia pages
include links to a range of sources that can serve as useful jumping off points
for more in-depth research. In fact, for this task, Wikipedia is a far better place to learn about both sides in the gun control debate than an NRA broadside.

Unfortunately, inflexible opposition to Wikipedia and an unfounded faith in
.edu URLs led students astray. The strategies students used to complete our tasks—making judgments based on surface features, reacting to the exis-
tence of evidence, and flatly rejecting Wikipedia—are outdated, one-size-
fits-all approaches. They are not only ineffective; they also create a false sense of security. When students deploy these antiquated strategies, they believe they are carefully consuming digital content. In fact, they are easy marks for digital rogues of all stripes.

How Can We Help Students?
Students’ evaluation strategies stand in stark contrast to professional fact checkers’ approach to unfamiliar digital sources. As part of our assessment development process, we observed fact checkers from the nation’s most prestigious news outlets as they completed online tasks.5 

When fact checkers encountered an unfamiliar website, they immediately left it and read laterally, opening up new browser tabs along the screen’s horizontal axis in order to see what other sources said about the original site’s author or sponsoring organization. Only after putting their queries
to the open web did checkers return to the original site, evaluating it in light of the new information they gleaned. 

In contrast, students approached the web by reading vertically, dwelling on the site where they first landed and closely examining its features—URL, appearance, content, and “About” page—without investigating who might be behind this content.

We refer to the ability to locate, evaluate, and verify digital information about
social and political issues as civic online reasoning. We use this term to highlight the essential role that evaluating digital content plays in civic life, where informed engagement rests on students’ ability to ask and answer these questions of online information:

  1. Who is behind it?
  2. What is the evidence for its claims?
  3. What do other sources say?

These are the core competencies of civic online reasoning that we’ve identified through a careful analysis of fact checkers’ evaluations. When they ask who’s behind information, students should investigate its authors, inquire into the motives (commercial, ideological, or otherwise) those people have to present the information, and decide whether they should be trusted. 

In order to investigate evidence, students should consider what evidence
is furnished, what source provided it, and whether it sufficiently supports the
claims made. Students should also seek to verify arguments by consulting multiple sources.

There is no silver bullet for combatting the forces that seek to mislead
online. Strategies of deception shift constantly and we are forced to make
quick judgments about the information that bombards us. What should we do to help students navigate this complex
environment? 

We believe students need a digital tool belt stocked with strategies
that can be used flexibly and efficiently. The core competencies of civic online reasoning are a starting place. For example, consider what would happen if students prioritized asking “Who is behind this information?” when they first visited acpeds.org. If they read laterally, they would be more likely to discover the American College of Pediatricians’ perspective. They might come across an article from Snopes, the fact-checking website, noting that the American College of Pediatricians “explicitly states a mission that is overtly political rather than medical in nature”6 

Or a Southern Poverty Law Center post that describes the ACP as a “fringe anti-LGBT hate group that masquerades as the premier U.S. association of pediatricians to push anti-LGBT junk science.” 7 

Similarly, students would come to very different conclusions about the video claiming to show voter fraud if they spent a minute reading laterally to address the question, “What’s the evidence for the claim?”

Wikipedia is another essential tool. We would never tell a carpenter not to
use a hammer. The same should hold true for the world’s fifth-most-trafficked website. The professional fact checkers that we observed frequently turned to Wikipedia as a starting place for their searches. Wikipedia never served as the final terminus, but it frequently provided
fact checkers with an overview and links to other sources. We need to teach students how to use Wikipedia in a similar way. 

As teachers, we also need to familiarize ourselves with how the site functions. Too often we have received responses from students indicating that they don’t trust Wikipedia because their teachers told them never to use it. Although far from perfect, Wikipedia has progressed far beyond its original incarnation in the early days of the web. Given the challenges students face online, we shouldn’t deprive them of this powerful tool.

In short, we must equip students with tools to traverse the online landscape. We believe integrating the core competen-cies of civic online reasoning across the curriculum is one promising direction. It will require the development of high quality resources, professional development for teachers, and time for professional collaboration. 

We have begun this work by making our tasks freely available on our website (sheg.stanford.edu). We are also collaborating with the Poynter Institute and Google. As part of this initiative, known as Media Wise, we are creating new lesson plans and professional development materials for teach-
ers. These resources will be available on our website in the coming months. 

This is a start, but more is needed. We hope others will join in this crucial work. At stake is the preparation of future voters to make sound, informed decisions in their communities and at the ballot box.

Notes

  1. Brett Edkins, “Americans Believe They Can Detect
    Fake News. Studies Show They Can’t,” Forbes (Dec.
    20, 2016), http://www.forbes.com/sites/brettedkins/2016/
    12/20/americans-believe-they-can-detect-fake-news-
    studies-show-they-cant/#f6778b4022bb.
  2. Joel Breakstone, Sarah McGrew, Mark Smith, Teresa
    Ortega, and Sam Wineburg, “Why We Need a New
    Approach to Teaching Digital Literacy,” Phi Delta
    Kappan 99, no.6 (2018): 27–32; Sarah McGrew,
    Joel Breakstone, Teresa Ortega, Mark Smith, and
    Sam Wineburg, “Can Students Evaluate Online
    Sources? Learning from Assessments of Civic
    Online Reasoning,” Theory and Research in Social
    Education 46, no. 2 (2018): 165–193, https://doi.
    org/10.1080/00933104.2017.1416320; Sarah McGrew,
    Teresa Ortega, Joel Breakstone, and Sam Wineburg,
    “The Challenge That’s Bigger Than Fake News:
    Civic Reasoning in a Social Media Environment,”
    American Educator 41, no. 3 (2017): 4–10.
  3. Stanford History Education Group, Evaluating
    Information: The Cornerstone of Civic Online
    Reasoning (Technical Report. Stanford, Calif.:
    Stanford University, 2016), https://purl.stanford.edu/
    fv751yt5934.
  4. Warren Throckmorton, “The American College of
    Pediatricians Versus the American College of
    Pediatrics: Who Leads and Who Follows?” [Blog
    post], (Oct. 6, 2011), http://www.wthrockmorton.
    com/2011/10/06/the-american-college-of-pediatricia
    ns-versus-the-american-academy-of-pediatrics-who-
    leads-and-who-follows/.
  5. Sam Wineburg and Sarah McGrew, “Lateral
    Reading and the Nature of Expertise: Reading Less
    and Learning More When Evaluating Digital
    Information,” Teachers College Record (in press),
    Stanford History Education Group Working Paper
    No. 2017-A1, Oct 9, 2017, https://papers.ssrn.com/
    sol3/papers.cfm? abstract_id=3048994
  6. Kim LaCapria, “American Pediatricians Issue
    Statement That Transgenderism is ‘Child Abuse’?”
    Snopes (February 26, 2017), http://www.snopes.com/fact-
    check/americas-pediatricians-gender-kids/.
  7. Southern Poverty Law Center (n.d.). American
    College of Pediatricians, http://www.splcenter.org/fighting-
    hate/extremist-files/group/american-college-
    pediatricians.

CommentLikeYou can also reply to this email to leave a comment.

Larry Cuban on School Reform and Classroom Practice © 2024. Manage your email settings or unsubscribe.

WordPress.com and Jetpack Logos

Get the Jetpack app

Subscribe, bookmark, and get real-time notifications – all from one app!

Download Jetpack on Google Play
Download Jetpack from the App Store
WordPress.com Logo and Wordmark title=


Part Two: Cheating in DCPS

DC Education Reform Ten Years After, 

Part 2: Test Cheats

Richard P Phelps

Ten years ago, I worked as the Director of Assessments for the District of Columbia Public Schools (DCPS). For temporal context, I arrived after the first of the infamous test cheating scandals and left just before the incident that spawned a second. Indeed, I filled a new position created to both manage test security and design an expanded testing program. I departed shortly after Vincent Gray, who opposed an expanded testing program, defeated Adrian Fenty in the September 2010 DC mayoral primary. My tenure coincided with Michelle Rhee’s last nine months as Chancellor. 

The recurring test cheating scandals of the Rhee-Henderson years may seem extraordinary but, in fairness, DCPS was more likely than the average US school district to be caught because it received a much higher degree of scrutiny. Given how tests are typically administered in this country, the incidence of cheating is likely far greater than news accounts suggest, for several reasons: 

·      in most cases, those who administer tests—schoolteachers and administrators—have an interest in their results;

·      test security protocols are numerous and complicated yet, nonetheless, the responsibility of non-expert ordinary school personnel, guaranteeing their inconsistent application across schools and over time; 

·      after-the-fact statistical analyses are not legal proof—the odds of a certain amount of wrong-to-right erasures in a single classroom on a paper-and-pencil test being coincidental may be a thousand to one, but one-in-a-thousand is still legally plausible; and

·      after-the-fact investigations based on interviews are time-consuming, scattershot, and uneven. 

Still, there were measures that the Rhee-Henderson administrations could have adopted to substantially reduce the incidence of cheating, but they chose none that might have been effective. Rather, they dug in their heels, insisted that only a few schools had issues, which they thoroughly resolved, and repeatedly denied any systematic problem.  

Cheating scandals

From 2007 to 2009 rumors percolated of an extraordinary level of wrong-to-right erasures on the test answer sheets at many DCPS schools. “Erasure analysis” is one among several “red flag” indicators that testing contractors calculate to monitor cheating. The testing companies take no responsibility for investigating suspected test cheating, however; that is the customer’s, the local or state education agency. 

In her autobiographical account of her time as DCPS Chancellor, Michelle Johnson (nee Rhee), wrote (p. 197)

“For the first time in the history of DCPS, we brought in an outside expert to examine and audit our system. Caveon Test Security – the leading expert in the field at the time – assessed our tests, results, and security measures. Their investigators interviewed teachers, principals, and administrators.

“Caveon found no evidence of systematic cheating. None.”

Caveon, however, had not looked for “systematic” cheating. All they did was interview a few people at several schools where the statistical anomalies were more extraordinary than at others. As none of those individuals would admit to knowingly cheating, Caveon branded all their excuses as “plausible” explanations. That’s it; that is all that Caveon did. But, Caveon’s statement that they found no evidence of “widespread” cheating—despite not having looked for it—would be frequently invoked by DCPS leaders over the next several years.[1]

Incidentally, prior to the revelation of its infamous decades-long, systematic test cheating, the Atlanta Public Schools had similarly retained Caveon Test Security and was, likewise, granted a clean bill of health. Only later did the Georgia state attorney general swoop in and reveal the truth. 

In its defense, Caveon would note that several cheating prevention measures it had recommended to DCPS were never adopted.[2] None of the cheating prevention measures that I recommended were adopted, either.

The single most effective means for reducing in-classroom cheating would have been to rotate teachers on test days so that no teacher administered a test to his or her own students. It would not have been that difficult to randomly assign teachers to different classrooms on test days.

The single most effective means for reducing school administratorcheating would have been to rotate test administrators on test days so that none managed the test materials for their own schools. The visiting test administrators would have been responsible for keeping test materials away from the school until test day, distributing sealed test booklets to the rotated teachers on test day, and for collecting re-sealed test booklets at the end of testing and immediately removing them from the school. 

Instead of implementing these, or a number of other feasible and effective test security measures, DCPS leaders increased the number of test proctors, assigning each of a few dozen or so central office staff a school to monitor. Those proctors could not reasonably manage the volume of oversight required. A single DC test administration could encompass a hundred schools and a thousand classrooms.

Investigations

So, what effort, if any, did DCPS make to counter test cheating? They hired me, but then rejected all my suggestions for increasing security. Also, they established a telephone tip line. Anyone who suspected cheating could report it, even anonymously, and, allegedly, their tip would be investigated. 

Some forms of cheating are best investigated through interviews. Probably the most frequent forms of cheating at DCPS—teachers helping students during test administrations and school administrators looking at test forms prior to administration—leave no statistical residue. Eyewitness testimony is the only type of legal evidence available in such cases, but it is not just inconsistent, it may be socially destructive. 

I remember two investigations best: one occurred in a relatively well-to-do neighborhood with well-educated parents active in school affairs; the other in one of the city’s poorest neighborhoods. Superficially, the cases were similar—an individual teacher was accused of helping his or her own students with answers during test administrations. Making a case against either elementary school teacher required sworn testimony from eyewitnesses, that is, students—eight-to-ten-year olds. 

My investigations, then, consisted of calling children into the principal’s office one-by-one to be questioned about their teacher’s behavior. We couldn’t hide the reason we were asking the questions. And, even though each student agreed not to tell others what had occurred in their visit to the principal’s office, we knew we had only one shot at an uncorrupted jury pool. 

Though the accusations against the two teachers were similar and the cases against them equally strong, the outcomes could not have been more different. In the high-poverty neighborhood, the students seemed suspicious and said little; none would implicate the teacher, whom they all seemed to like. 

In the more prosperous neighborhood, students were more outgoing, freely divulging what they had witnessed. The students had discussed the alleged coaching with their parents who, in turn, urged them to tell investigators what they knew. During his turn in the principal’s office, the accused teacher denied any wrongdoing. I wrote up each interview, then requested that each student read and sign. 

Thankfully, that accused teacher made a deal and left the school system a few weeks later. Had he not, we would have required the presence in court of the eight-to-ten-year olds to testify under oath against their former teacher, who taught multi-grade classes. Had that prosecution not succeeded, the eyewitness students could have been routinely assigned to his classroom the following school year.

My conclusion? Only in certain schools is the successful prosecution of a cheating teacher through eyewitness testimony even possible. But, even where possible, it consumes inordinate amounts of time and, otherwise, comes at a high price, turning young innocents against authority figures they naturally trusted. 

Cheating blueprints

Arguably the most widespread and persistent testing malfeasance in DCPS received little attention from the press. Moreover, it was directly propagated by District leaders, who published test blueprints on the web. Put simply, test “blueprints” are lists of the curricular standards (e.g., “student shall correctly add two-digit numbers”) and the number of test items included in an upcoming test related to each standard. DC had been advance publishing its blueprints for years.

I argued that the way DC did it was unethical. The head of the Division of Data & Accountability, Erin McGoldrick, however, defended the practice, claimed it was common, and cited its existence in the state of California as precedent. The next time she and I met for a conference call with one of DCPS’s test providers, Discover Education, I asked their sales agent how many of their hundreds of other customers advance-published blueprints. His answer: none.

In the state of California, the location of McGoldrick’s only prior professional experience, blueprints were, indeed, published in advance of test administrations. But their tests were longer than DC’s and all standards were tested. Publication of California’s blueprints served more to remind the populace what the standards were in advance of each test administration. Occasionally, a standard considered to be of unusual importance might be assigned a greater number of test items than the average, and the California blueprints signaled that emphasis. 

In Washington, DC, the tests used in judging teacher performance were shorter, covering only some of each year’s standards. So, DC’s blueprints showed everyone well in advance of the test dates exactly which standards would be tested and which would not. For each teacher, this posed an ethical dilemma: should they “narrow the curriculum” by teaching only that content they knew would be tested? Or, should they do the right thing and teach all the standards, as they were legally and ethically bound to, even though it meant spending less time on the to-be-tested content? It’s quite a conundrum when one risks punishment for behaving ethically.

Monthly meetings convened to discuss issues with the districtwide testing program, the DC Comprehensive Assessment System (DC-CAS)—administered to comply with the federal No Child Left Behind (NCLB) Act. All public schools, both DCPS and charters, administered those tests. At one of these regular meetings, two representatives from the Office of the State Superintendent of Education (OSSE) announced plans to repair the broken blueprint process.[3]

The State Office employees argued thoughtfully and reasonably that it was professionally unethical to advance publish DC test blueprints. Moreover, they had surveyed other US jurisdictions in an effort to find others that followed DC’s practice and found none. I was the highest-ranking DCPS employee at the meeting and I expressed my support, congratulating them for doing the right thing. I assumed that their decision was final.

I mentioned the decision to McGoldrick, who expressed surprise and speculation that it might have not been made at the highest level in the organizational hierarchy. Wasting no time, she met with other DCPS senior managers and the proposed change was forthwith shelved. In that, and other ways, the DCPS tail wagged the OSSE dog. 

* * *

It may be too easy to finger ethical deficits for the recalcitrant attitude toward test security of the Rhee-Henderson era ed reformers. The columnist Peter Greene insists that knowledge deficits among self-appointed education reformers also matter: 

“… the reformistan bubble … has been built from Day One without any actual educators inside it. Instead, the bubble is populated by rich people, people who want rich people’s money, people who think they have great ideas about education, and even people who sincerely want to make education better. The bubble does not include people who can turn to an Arne Duncan or a Betsy DeVos or a Bill Gates and say, ‘Based on my years of experience in a classroom, I’d have to say that idea is ridiculous bullshit.’”

“There are a tiny handful of people within the bubble who will occasionally act as bullshit detectors, but they are not enough. The ed reform movement has gathered power and money and set up a parallel education system even as it has managed to capture leadership roles within public education, but the ed reform movement still lacks what it has always lacked–actual teachers and experienced educators who know what the hell they’re talking about.”

In my twenties, I worked for several years in the research department of a state education agency. My primary political lesson from that experience, consistently reinforced subsequently, is that most education bureaucrats tell the public that the system they manage works just fine, no matter what the reality. They can get away with this because they control most of the evidence and can suppress it or spin it to their advantage.

In this proclivity, the DCPS central office leaders of the Rhee-Henderson era proved themselves to be no different than the traditional public-school educators they so casually demonized. 

US school systems are structured to be opaque and, it seems, both educators and testing contractors like it that way. For their part, and contrary to their rhetoric, Rhee, Henderson, and McGoldrick passed on many opportunities to make their system more transparent and accountable.

Education policy will not improve until control of the evidence is ceded to genuinely independent third parties, hired neither by the public education establishment nor by the education reform club.

The author gratefully acknowledges the fact-checking assistance of Erich Martel and Mary Levy.

Access this testimonial in .pdf format

Citation:  Phelps, R. P. (2020, September). Looking Back on DC Education Reform 10 Years After, Part 2: Test Cheats. Nonpartisan Education Review / Testimonials. https://nonpartisaneducation.org/Review/Testimonials/v16n3.htm


[1] A perusal of Caveon’s website clarifies that their mission is to help their clients–state and local education departments–not get caught. Sometimes this means not cheating in the first place; other times it might mean something else. One might argue that, ironically, Caveon could be helping its clients to cheat in more sophisticated ways and cover their tracks better.

[2] Among them: test booklets should be sealed until the students open them and resealed by the students immediately after; and students should be assigned seats on test day and a seating chart submitted to test coordinators (necessary for verifying cluster patterns in student responses that would suggest answer copying).

[3] Yes, for those new to the area, the District of Columbia has an Office of the “State” Superintendent of Education (OSSE). Its domain of relationships includes not just the regular public schools (i.e., DCPS), but also other public schools (i.e., charters) and private schools. Practically, it primarily serves as a conduit for funneling money from a menagerie of federal education-related grant and aid programs

PISA shows great US education progress under Common Core, charter proliferation, reforms. (JUST KIDDING!)

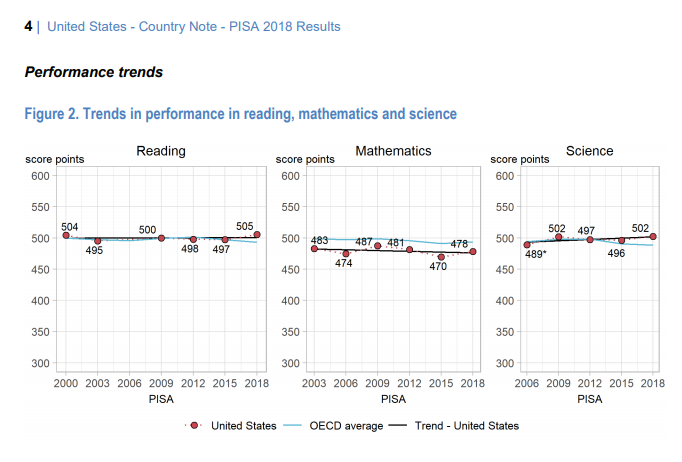
If there is anything that the recent PISA results show, it’s that the promises by David Coleman, Bill Gates, Michelle Rhee, Betsy Devos, Arne Duncan, Barack Obama, and others of tremendous achievement increases and closing socioeconomic gaps with their ‘reforms’ were completely unfilled. I am copying and pasting here how American students have done on the PISA, a test given in many, many countries, since 2006. There have been tiny changes over the past dozen years in the scores of American students in reading, math, and science, but virtually none have been statistically significant, according to the statisticians who compiled and published the data.

Then again, nearly any classroom teacher you talked to over the past decade or two of educational ‘reforms’ in American classrooms could have told you why and how it was bound to fail.

Look for yourself:

PISA results through 2018


Source: https://www.oecd.org/pisa/publications/PISA2018_CN_USA.pdf


EDIT: I meant David Coleman the educational reform huckster, not Gary Coleman the actor!


Can You See The Educational Miracles in DC, Florida, Michigan, and Mississippi?

No?

Even though the Common Core curriculum is now essentially the law of the land (though well disguised), and nearly every school system devotes an enormous amount of its time to testing, and many states and cities (such as DC, Florida, and Michigan) are hammering away at public schools and opening often-unregulated charter schools and subsidizing voucher schemes?

You don’t see the miracles that MUST have flowed from those ‘reforms’?

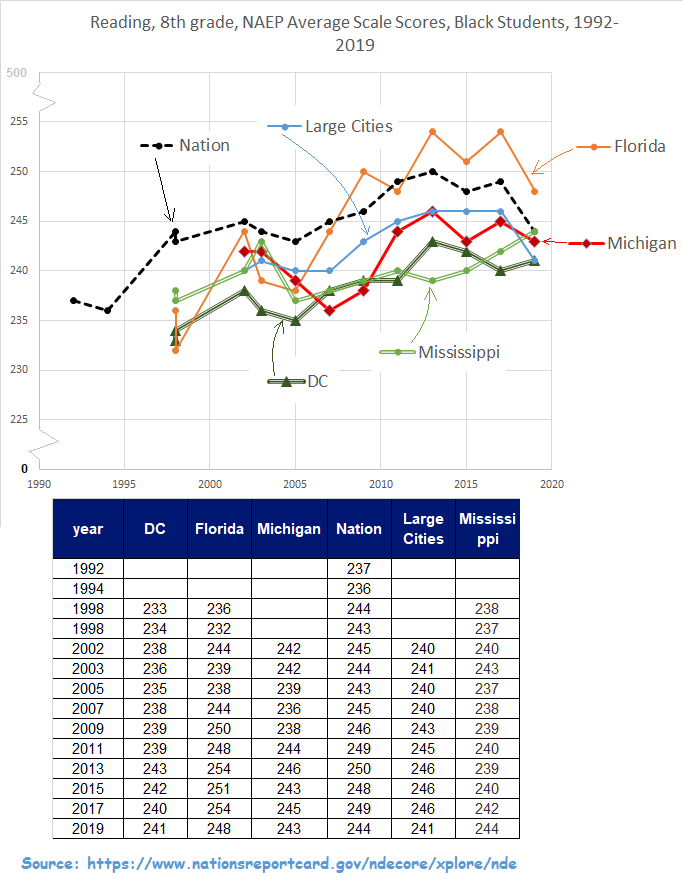
naep reading 8th grade, black, nation, fl, dc, mi, ms, large cities

Neither can I.

I present to you average scale scores for black students on the 8th grade NAEP reading tests, copied and pasted by from the NAEP website for the past 27 years, and graphed by me using Excel. You will notice that any changes have been small — after all, these scores can go up to 500 if a student gets everything right, and unlike on the SAT, the lowest possible score is zero.

DC’s black 8th graders are scoring slightly lower than in 2013 or 2015, even though a speaker assured us that DC was an outstanding performer. Black Florida students are scoring lower than they did 2, 4, 6, or 10 years ago, even though Betsy DeVos assured us that they were setting a wonderful example for the nation. Michigan is the state where DeVos and her family has had the most influence, and it consistently scores lower than the national average. Mississippi was held up for us as a wonderful example of growth, but their score is exactly one point higher than it was in 2003.

Some miracles.


EDIT: Here are the corresponding charts and graphs for hispanic and white students:

naep, 8th grade reading, hispanic, various places


naep 8th grade reading, white students, various places

Charter schools do NOT get better NAEP test results than regular public schools

It is not easy to find comparisons between charter schools and regular public schools, partly because the charter schools are not required to be nearly as transparent or accountable as regular public schools. (Not in their finances, nor in requests for public records, nor for student or teacher disciplinary data, and much more.) At the state or district level, it has in the past been hard or impossible to find comparative data on the NAEP (National Assessment of Educational Progress).

We all have heard the propaganda that charter and voucher schools are so much better than regular public schools, because they supposedly get superior test scores and aren’t under the thumb of  those imaginary ‘teacher union thugs’.

However, NCES has released results where they actually do this comparison. Guess what: there is next to no difference between the scores of all US charter schools on the NAEP in both reading and math at either the 4th grade or 8th grade level! In fact, at the 12th grade, regular public schools seem to outscore the charter schools by a significant margin.

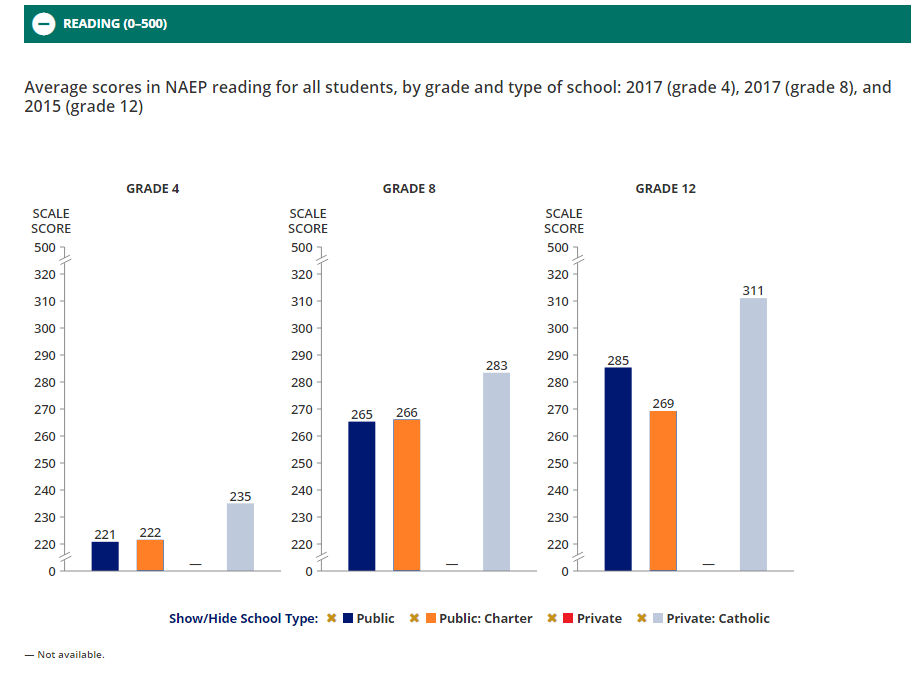
Take a look at the two graphs below, which I copied and pasted from the NCES website. The only change I made was to paint orange for the bar representing the charter schools. Note that there is no data available for private schools as a whole.

public vs charter vs catholic, naep, math

If you aren’t good at reading graphs, the one above says that on a 500-point scale, in 2017 (which was the last year for which we have results), at the 4th grade, regular public school students scored an average of 239 points in math, three points higher than charter school students (probably not a significant difference). At the 8th grade level, the two groups scored identically: 282 points. At the 12th grade, in 2015, regular public school students outscored charter school students by a score of 150 to 133 on a 300-point scale (I suspect that difference IS statistically significant). We have no results from private schools, but Catholic schools do have higher scores than the public or charter schools.

The next graph is for reading. At the 4th grade, charter school students in 2017 outscored regular public school students by a totally-insignificant 1 point (222 to 221 on a 500 point scale) and the same thing happened at the 8th grade level (266 to 265 on a 500 point scale). However, at the 12th grade, the regular public school students outscore their charter school counterparts by a score of 285 to 269, which I bet is significant.

charter vs public vs catholic, naep, reading, 2017


Progress (or Not) for DC’s 8th Graders on the Math NAEP?

8th grade naep math, DC, w + H + B

Here we have the average scale scores on the math NAEP for 8th grade students in Washington, DC.* You will notice that we don’t have data for 8th grade white students in DC in math for the years 2003, 2007, and 2009, because there weren’t enough white students taking the test in those years for the statisticians at NCES to be confident in their data.

The vertical, dashed, red line near the middle of the graph represents the date when the old, elected, DC school board was replaced by Chancellors Rhee, Henderson, and Wilson, directly appointed by the various mayors. That year (2007) was also when Rhee and her underlings instituted brand-new teacher evaluation systems like IMPACT and VAM and new curricula and testing regimes known as Common Core, PARCC, and so on. Hundreds, if not thousands, of teachers were either fired or resigned or took early retirement. If these reforms had been as successful as Rhee promised in writing, then the lines representing scores for white, black, and hispanic students in DC would go slanting strongly up and to the right after that 2007 change.

I don’t see it.

Do you?

In fact, let’s look carefully at the slopes of the lines pre-Rheeform and post-Rheeform.

For black 8th grade students, scores went from 231 to 245 in the years 2000 to 2007, or 14 points in 7 years, which is a  rise of 2.0 points per year. After mayoral control, the scores for black students went from 245 to 257, or 12 points in 10 years. That’s rise of 1.2 points per year.

Worse, not better.

For Hispanic students, scores went from 236 in the year 2000 to 251 in 2007, a rise of 15 points in 7 years, or a rise of about 2.1 points per year. After mayoral control, their scores went from 251 to 263 in 10 years, which is a rise of 1.2 points per year.

Again: Worse, not better.

With the white students, a lot of data is missing, but I’ll compare what we have. Their scores went from 300 in year 2000 to 317 in the year 2005, which is an increase of 3.4 points per year. After mayoral control, their scores went from 319 in 2011 to 323, in 2017 or a rise of four (4!) points in 6 years, which works out to about 0.6 points per year.

Once again, Worse, not better.

Voters, you have the power to stop this nonsense, if you get organized!

—————————————————-

* Note that I’m using the numbers for Washington DC as a whole – which includes the regular DC Public School system, all the charter schools, as well as private (aka ‘independent’) and parochial schools. At one point, NAEP divided the DC scores into those for DCPS only (on the one hand) and for everybody else. In addition, they began to make it possible to separate out charter schools. However, since the regular public schools and the charter schools together educate the vast majority of students in DC, and the DCPS-only score-keeping started well after 2007, I decided to use the scores for all of DC because there was a much longer baseline of data, going back about twenty years.

=================================================

Here are my previous posts on this matter:

  1. https://gfbrandenburg.wordpress.com/2018/04/16/just-how-much-success-has-there-been-with-the-reformista-drive-to-improve-scores-over-the-past-20-years/
  2. https://gfbrandenburg.wordpress.com/2018/04/16/maybe-there-was-progress-with-hispanic-students-in-dc-and-elsewhere/
  3. https://gfbrandenburg.wordpress.com/2018/04/16/progress-perhaps-with-8th-grade-white-students-in-dc-on-naep-after-mayoral-control/
  4. https://gfbrandenburg.wordpress.com/2018/04/16/was-there-any-progress-in-8th-grade-math-on-the-naep-in-dc-or-elsewhere/
  5. https://gfbrandenburg.wordpress.com/2018/04/17/one-area-with-a-bit-of-improvement-4th-grade-math-for-black-students-on-the-naep/
  6. https://gfbrandenburg.wordpress.com/2018/04/17/more-flat-lines-4th-grade-reading-for-hispanic-and-white-students-dc-and-nationwide/
  7. https://gfbrandenburg.wordpress.com/2018/04/17/the-one-area-where-some-dc-students-improved-under-mayoral-control-of-education/
  8. https://gfbrandenburg.wordpress.com/2018/04/20/how-dcs-black-white-and-hispanic-students-compare-with-each-other-on-the-naep-over-the-past-20-years/
  9. https://gfbrandenburg.wordpress.com/2018/04/20/comparing-dcs-4th-grade-white-black-and-hispanic-students-in-the-math-naep/
  10. https://gfbrandenburg.wordpress.com/2018/04/20/dcs-black-hispanic-and-white-students-progress-on-the-naep-under-mayoral-control-and-before-8th-grade-reading/

DC’s Black, Hispanic and White Students Progress on the NAEP Under Mayoral Control and Before – 8th Grade Reading

8th grade naep reading, DC, B + W + H

We are looking at the average scale scores for 8th grade black, Hispanic, and white students in DC on the NAEP reading tests over the past two decades. Ten years ago, Washington DC made the transition from a popularly-elected school board to direct mayoral control of the school system. Michelle Rhee and Kaya Henderson, our first and second Chancellors under the new system, promised some pretty amazing gains if they were given all that power and many millions of dollars from the Walton, Arnold, and Broad foundations, and I showed that almost none of their promises worked out.

In the graph above, the vertical, dashed, green line shows when mayoral control was imposed, shortly after the end of school in 2007, so it marks a convenient end-point for school board control and a baseline for measuring the effects of mayoral control.

For 8th grade black students in reading in DC, their average scale scores went from 233 in 1998 to 238 in 2007, under the elected school board, which is a (very small) rise of 5 points in 9 years, or about 0.6 points per year. Under mayoral control, their scores went from 238 to 240, which is an even tinier increase of 2 points in 10 years, or 0.2 points per year.

Worse, not better.

For the Hispanic students, scores only increased from 246 to 249 before we had chancellors, or 3 points in 9 years, or about 0.3 points per year. After mayoral control, their scores went DOWN from 249 to 242 in 10 years, or a decrease of 0.7 points per year.

Again, worse, not better: going in the wrong direction entirely.

For white DC 8th graders, it’s not possible to make the same types of comparisons, because there were not sufficient numbers of white eighth-grade students in DC taking the test during five of the last ten test administrations for the NCES statisticians to give reliable results. However, we do know that in 2005 (pre-mayoral control) white 8th graders in DC scored 301 points. And since the mayors and the chancellors took over direct control of education in DC, not once have white students scored that high.

Again, worse, not better.

Why do we keep doing the same things that keep making things worse?

==============================================

My previous posts on this topic:

  1. https://gfbrandenburg.wordpress.com/2018/04/20/comparing-dcs-4th-grade-white-black-and-hispanic-students-in-the-math-naep/
  2. https://gfbrandenburg.wordpress.com/2018/04/17/the-one-area-where-some-dc-students-improved-under-mayoral-control-of-education/
  3. https://gfbrandenburg.wordpress.com/2018/04/17/more-flat-lines-4th-grade-reading-for-hispanic-and-white-students-dc-and-nationwide/
  4. https://gfbrandenburg.wordpress.com/2018/04/17/one-area-with-a-bit-of-improvement-4th-grade-math-for-black-students-on-the-naep/
  5. https://gfbrandenburg.wordpress.com/2018/04/16/was-there-any-progress-in-8th-grade-math-on-the-naep-in-dc-or-elsewhere/
  6. https://gfbrandenburg.wordpress.com/2018/04/16/progress-perhaps-with-8th-grade-white-students-in-dc-on-naep-after-mayoral-control/
  7. https://gfbrandenburg.wordpress.com/2018/04/16/maybe-there-was-progress-with-hispanic-students-in-dc-and-elsewhere/
  8. https://gfbrandenburg.wordpress.com/2018/04/16/just-how-much-success-has-there-been-with-the-reformista-drive-to-improve-scores-over-the-past-20-years/


How DC’s Black, White, and Hispanic Students Compare With Each Other on the NAEP Over the Past 20 Years

I will present here four graphs and tables showing how DC’s three main ethnic/racial groups performed on the National Assessment of Educational Progress (NAEP) in math and reading at the 4th and 8th grade levels, as far back as I could find data on the NAEP Data Explorer web page. This time, I will compare the average scale scores for each group with each other.

4th grade naep reading, DC's W, B, H

The vertical, dashed, purple line in the middle of the graph shows the division between the era when we DC citizens could elect our own school board (to the left) and the era when the mayor had unilateral control over education, which he or she implemented by appointing a Chancellor and a Deputy Mayor for Education. That change occurred right after the end of school in 2007.

If direct mayoral control of education in DC were such a wonderful reform, then you would see those lines for black and hispanic students start going sharply up and to the right after they passed that purple line.

I see no such dramatic change. Do you? In fact, do you see any change in trends at all?

In fact, for both white and Hispanic fourth-graders, the average scale score in 2017 is slightly LOWER than it was in 2007.

For black 4th graders, there has been an increase in scores since 2007, but those scores were also increasing before 2007. In fact, if we start at 1998 and go to 2007, the average scale score in reading for black students went from 174 to 192, which is an increase of 18 points in 9 years, or about 2.0 points per year. If we follow the same group  from 2007 to 2017, their scores went from 192 to 207, which is an increase of 15 points in 10 years. Divide those two numbers and you get a rate of increase of 1.5 points per year.

That’s worse.

Not better.

(Anybody familiar with Washington, DC knows that there is essentially no working-class white population inside the city limits — they all moved away during the 1950s, 60s and 70s rather than live in integrated or expensive neighborhoods. A very large fraction of the white families still living in DC have either graduate or professional degrees (lawyers, doctors, engineers, etc.). I  don’t know of any other city in the US which has shed its entire white working class. We know from all educational research that parental education and income are extremely strong influences on how their children perform on standardized tests (because that’s how the tests are constructed). White children in DC, as a result, whether they attend regular public schools, charter schools, or private schools, are the highest-performing group of white students of any state or city for which we have statistics.)


Progress (or not) in DC public schools after democracy was discarded

I continue looking at the (lack of) miraculous progress in education in the District of Columbia, my home town, ever since PERAA was passed and the democratically-elected school board was stripped of all of its power.

Today I am comparing the progress of successive cohorts of white, Hispanic, and black students about 11 years afterwards as shown on the National Assessment of Educational Progress, or NAEP, which is given nation-wide to carefully-selected samples of students. In a few months we will have the 2017 NAEP scores available, which I will add on to these graphs. So far, however, I do not see any evidence that the gap between the reading and math scores for 4th or 7th grade students in DC — which is the largest gap of any city or state measured – has been eliminated.

Look for yourself.

As in my previous posts, I drew a vertical red line in the year 2008 (not a NAEP testing year) because that separates the scores obtained under the ancien regime and the scores under PERAA. The NAEP is not given every single year, and in some years, scores were not published for some groups because of statistical reliability issues. I drew in dotted lines in those cases. All my data is taken from the NCES DATA explorer, and you are free to check it yourself.

Here are my graphs for 4th and 8th grade math. Click on them to see an enlarged version. Do you see any evidence of the educational miracle that is often advertised as happening AFTER mayoral control of schools? Me neither.


And here are my graphs for 4th and 8th grade reading:

Again: Do you see any miracle happening after that vertical red line?

You can see my previous posts on this here and here.

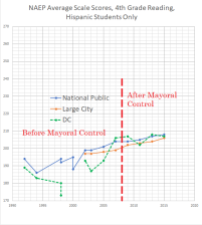
Has Mayoral Control In DC Caused A Miracle Regarding Hispanic Students?

I will now post graphs showing how Hispanic students in fourth and eighth grade in DC have scored in math and reading in comparison to other US large cities and the nation’s public schools. As with the previous post, I drew a thick, vertical, red, dotted line showing where the previous, democratically-elected school board was replaced by mayoral control under a law called PERAA.

Here are the ‘average scale scores’ for eighth-grade Hispanic students in math and reading in DC (green), the NAEP sample of Hispanic 8th graders in US large cities (orange), and the NAEP sample of all Hispanic 8th grade students in public schools:

Do you see a miracle that happened to the right of that dotted red line?

I don’t.

What I do see is that in math, the rate of improvement for DC’s Hispanic 8th graders from 2000 to 2007 (under democratic local control of schools) seems considerably faster than the corresponding rate afterwards (under mayoral control).

In reading, it seems like Hispanic 8th grade students in DC were scoring generally higher than their national peers, but after PERAA, they scored lower than their peers. Some miracle.

Let’s look at 4th grade:

Once again, from 2000 through 2007 (under local democratic control of schools), the rate of increase in DC Hispanic students’ scores in both math and reading was considerably higher than after the mayor took over.

Some miracle.